Diagnostic Tools, SSL Checks & More
It's been busy since v1.47.3, and this release brings all of it together. We rebuilt our diagnostic tools into one unified experience across every surface, developed an SSL/TLS certificate checker into our diagnostic tools, enabled IP lookup in WHOIS, made timestamps across the app respect your timezone, and improved monitoring with bulk actions, IP matching rules, and clearer failure messages.
Diagnostic Tools, Reimagined
We unified our diagnostic tools into one consistent experience. Whether you're using the public tools at www.emercom.io/tools or tools.emercom.io, signed in to your account, or reaching them from your organization dashboard, you now get the same clean form, the same server selection, and the same rich result views everywhere — with a dedicated Tools item in your dashboard navigation.
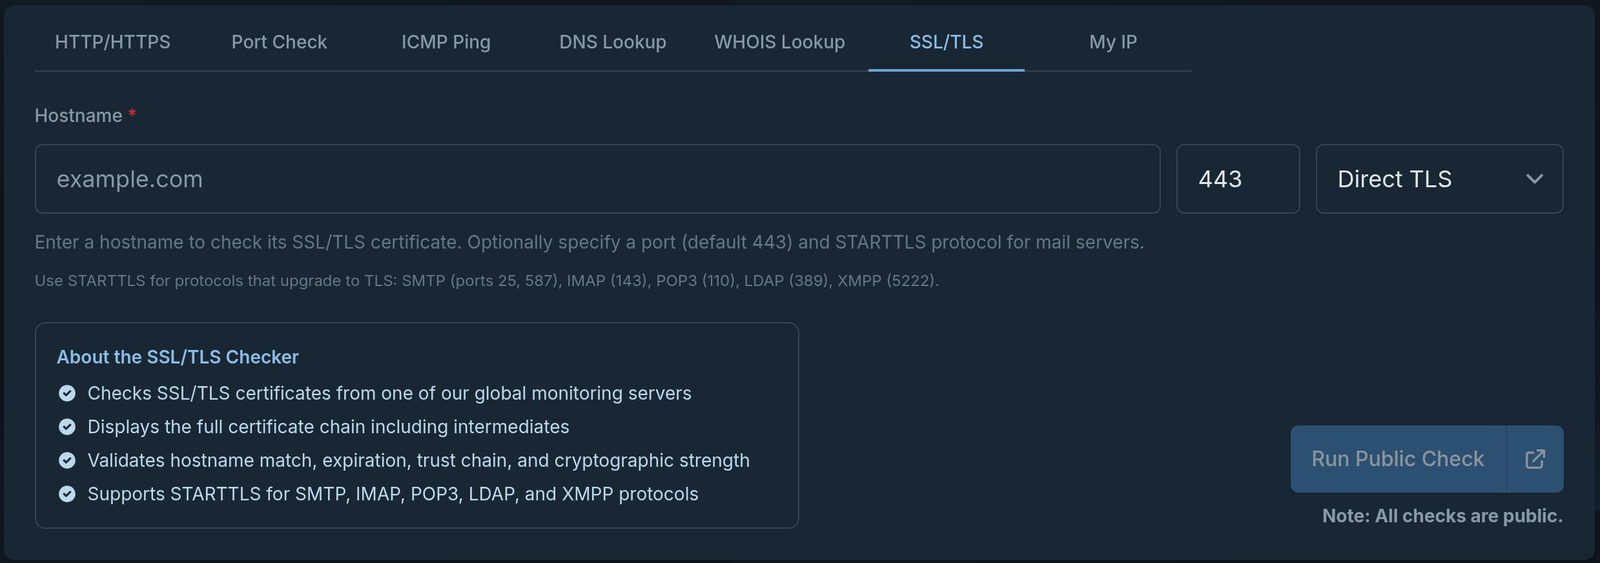
- SSL/TLS Certificate Checker: a brand-new SSL tab checks certificate expiry, validity, SANs, OCSP status, and the full certificate chain. It supports STARTTLS for SMTP, FTP, IMAP, POP3, LDAP, and XMPP, so you can inspect certificates on non-HTTPS services too. Results are shareable via a link, and you can download the leaf and chain PEM files.
- WHOIS for IP addresses: the WHOIS tool now accepts IP targets. Look up an IP to see its network range, CIDR block, owning registry, organization, and abuse contacts, with the interface clearly distinguishing IP lookups from domain lookups.
- Linkable tool tabs: each check type now has its own address:
/http,/port,/dns,/whois,/icmp, and/ssl. Share a direct link and your recipient lands right on the correct tool. - Shareable result sections: result pages now track the active section (Headers, SSL, DNS, MTR, dig, and more) in a
?section=parameter that survives a refresh, so you can link someone straight to the exact detail you're looking at. - Prefill via URL: the Check page accepts
?target=,?host=, and?port=to pre-fill fields without auto-submitting, and the What's My IP page accepts?q=<ip>to look up any public IP — perfect for bookmarks and quick-action links. - Your checks, saved: sign in on www.emercom.io/tools and the checks you run are kept in your account history, ready to revisit or share later.
Richer Results
- DNS diagnostics with filter, sort & compact view: DNS results now match HTTP, Port, and ICMP, with a record-type selector (A, AAAA, MX, and more), status filtering, sorting, and a compact/detailed toggle. The compact table shows query times and resolved values per record type.
- IP address hover enrichment: hover over any IP address in check results, one-time checks, or monitoring rows to see its provider, ASN, city, and country.
- Full diagnostic output: complete MTR (traceroute) results and other lengthy command output now load in full instead of being cut off at a short preview.
Monitoring
More control over monitored resources, and fewer false alarms.
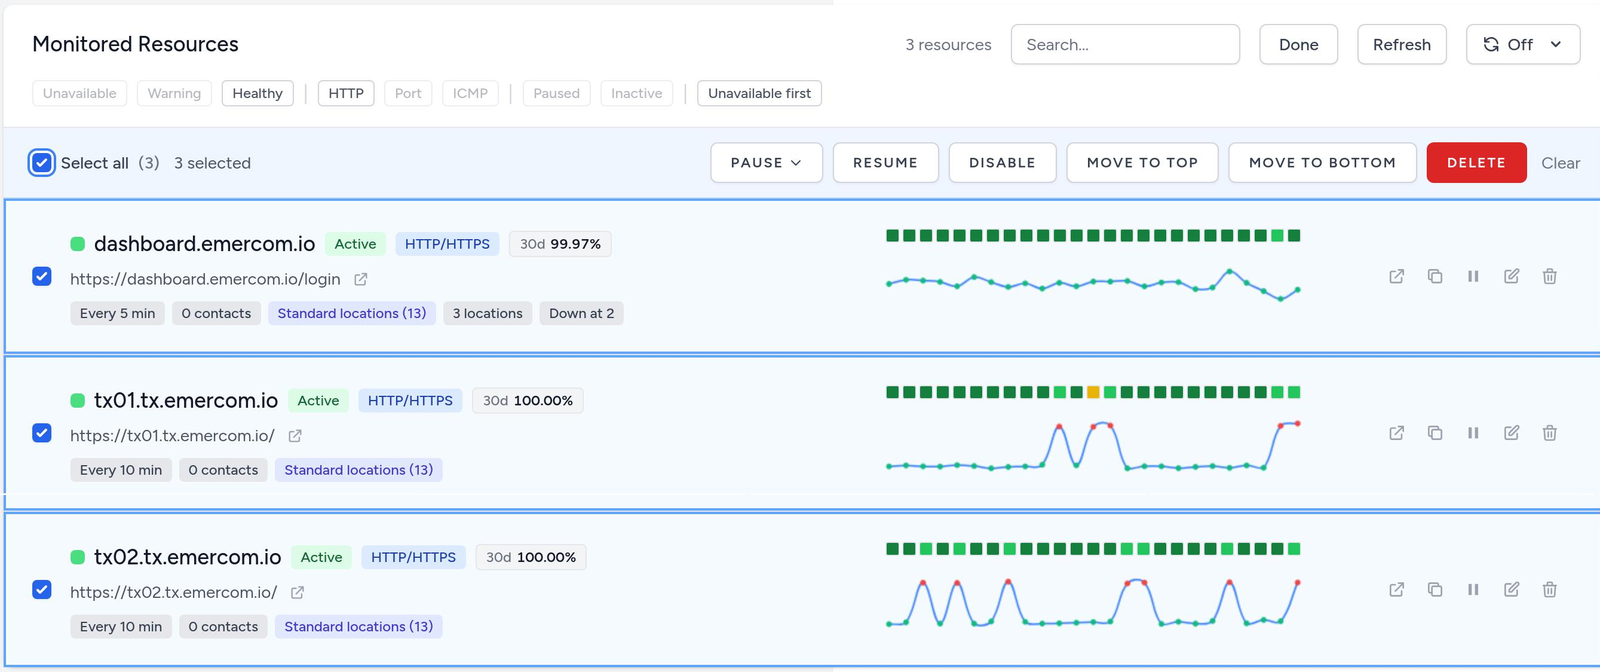
- Bulk actions: turn on Select mode on the Monitored Resources index and a sticky action bar lets you pause (from 10 minutes up to 24 hours), resume, disable, move to top or bottom, or delete many resources at once. There's a "Select all" option and a live selection count.
- IP matching rules: add allowlist and blocklist rules to HTTP, Port, and ICMP resources using exact IPs, CIDR blocks, ASN ranges, or wildcards. A check fails if the resolved IP breaks your rules — handy for catching unauthorized IP changes, unexpected CDN failover, or DNS hijacking.
- 3-minute check interval: a new 3m option sits between 1m and 5m on the Create and Edit forms, for a tighter cadence when you need it.
- Better HTTP forensics: failed HTTP checks now capture the full response headers as their own Forensic Snapshot, giving you more to work with when something breaks.
- Healthy baselines: diagnostic snapshots are also captured periodically while a resource is healthy, so when a failure hits you can compare it against a known-good picture from shortly before.
- Smarter expected status codes: the Expected HTTP Status Codes field is now grouped by category (2xx/3xx/4xx/5xx), includes more codes (403, 404, and the 5xx family), and explains what each code means on hover.
- Friendlier failure messages: check failures now read in plain language ("Monitoring server temporarily unreachable" or "Monitoring node could not complete the check") instead of technical jargon.
Status Pages
- Incident detail pages: every incident on a public status page now has its own page, with a full timeline from the moment it was created through each update to resolution.
Billing & Credits
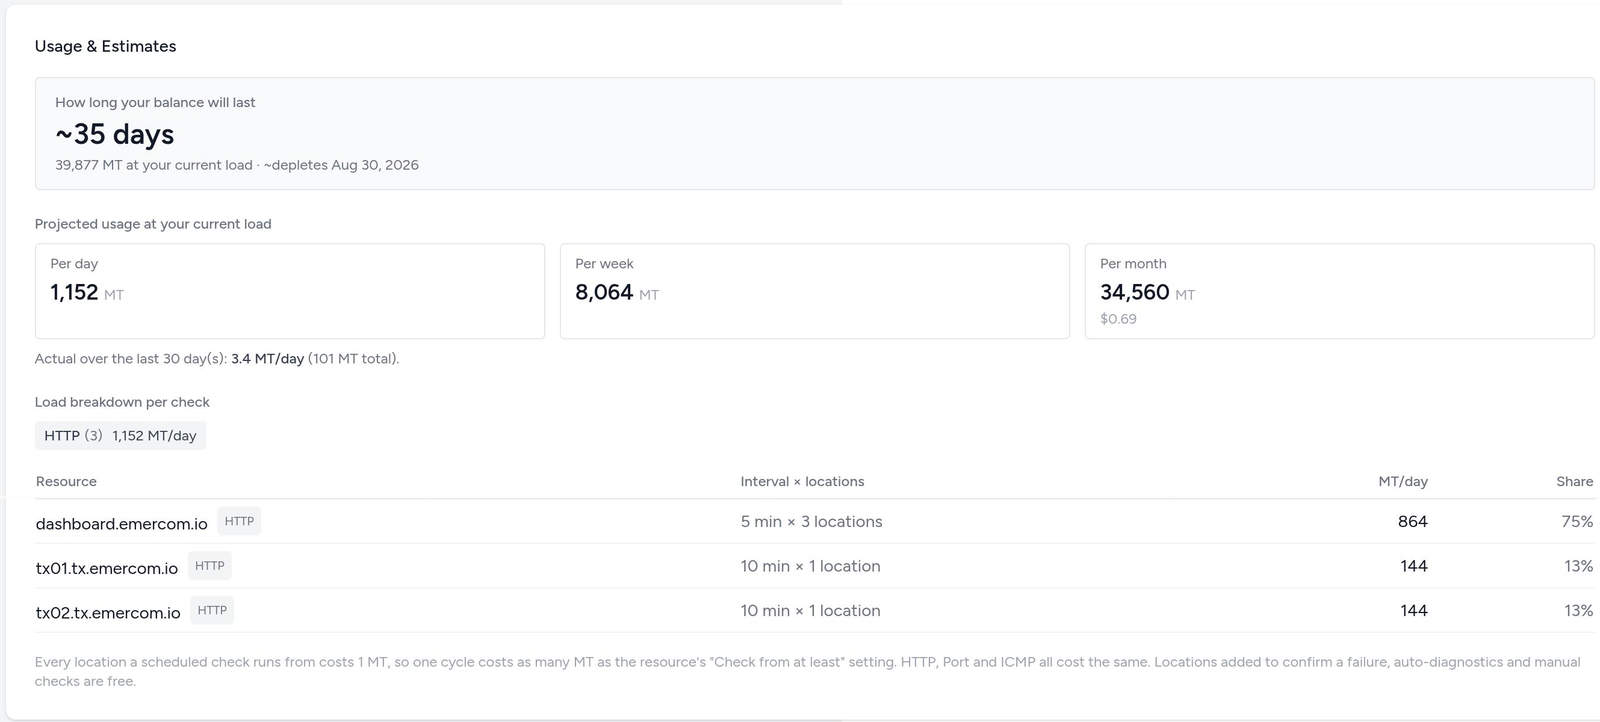
- Usage & Estimates: every credit-type tab now shows your projected burn rate per day, week, and month, your runway until the balance runs out, and a per-unit breakdown: cost per resource by type for Monitoring credits, per status page for Status credits, and per delivery channel for Notification credits, with a 30-day historical comparison.
Time & Localization
Timestamps across Emercom now follow your timezone.
- Timezone-aware timestamps: "Checked at," "Last checked," SSL certificate validity dates, diagnostic timestamps, status-page incident times, and billing dates all render in your selected timezone. Hover any timestamp to see its UTC value, the active timezone name, and a quick "Change timezone" button.
- 12h / 24h clock toggle: pick the clock format you prefer.
What's Next
We're continuing to refine the unified Diagnostic Tools experience and bringing more of the platform under the same polish. As always — thank you for monitoring with Emercom, and keep the feedback coming.